Problem Set 5
Introduction
In this problem set, you will use data from the American Time Use Survey (ATUS) to create maps at the state and county level of time spent on social and recreational activities, time spent on education-related activities, and time spent working. All data have been aggregated to the state-level for you and are measured in minutes spent on an average day. The data can be downloaded here. You will create the maps asked for in the question and write no more than three sentences using the maps to answer the question. Turn in a word document with your maps and answers, a .do file with your code, and a .log file with your log files from your analysis.
Questions 1 and 2 will use maptile while question 3 will use spmap. In the ATUS, only counties with a population greater than 100,000 people are included.
Questions
- Create a state map that shows time spent on education-related activities in 2005, 2019, and 2023 (3 separate maps). How have the patterns of time spent on education activities across states changed over time? Which states have changed the most?
These can use either real state boundaries or state hexes.
Create a map that presents time spent on work-related activities and socializing and recreational activities across counties (2 separate maps). What jumps out to you when comparing counties on these two time-use dimensions?
Using the shape file and the
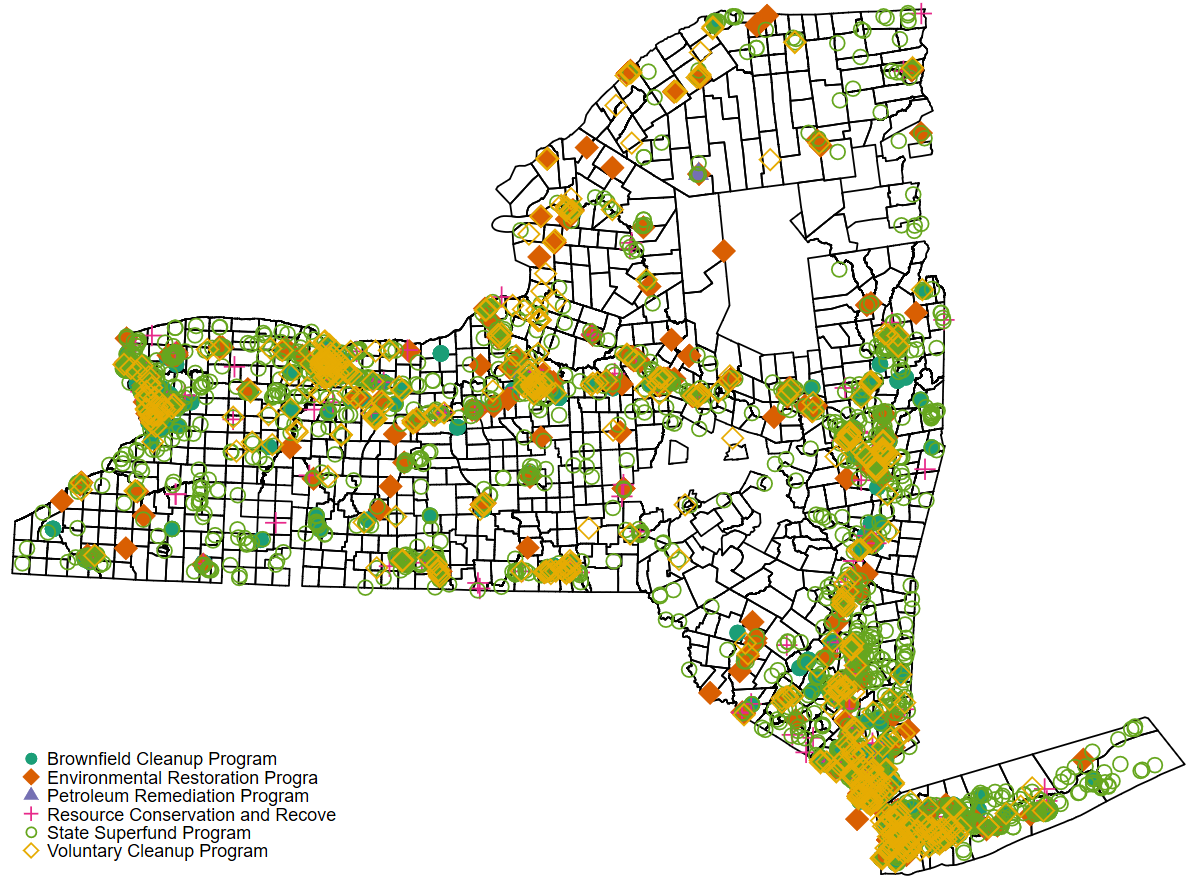
ny_cleanupsites.dtadata, create a map that plots the environmental clean-up sites across New York. Represent the sites as blue plus signs.
You will want to use a m:m merge on county, like we did in the lab, but may want to create a lowercase version of county before you do so. You will want to use the force option with your merge command, for the purposes of this exercise. Note that objectid functions the same as schid in this context. You will want to use a m:m merge on county, like we did in the lab, but may want to create a lowercase version of county before you do so. You will want to use the force option with your merge command and only keep observations where _merge == 3 after the merge, for the purposes of this exercise. Note that objectid functions the same as schid in this context.
Extra Credit
- Recreate this map and type the code you used underneath your map. Worth 5 points.
The color scheme used in the map is Dark2. The rest uses customization of the map made for question 3 using a few options you can find in the help file.
